E-Commerce Records Smashed IBM and Comscore have started releasing data on Black Friday and Cyber Monday E-Commerce trends in the US consumer market. Both companies aggregate and anonymize visitor and e-commerce statistics from 1000s of the top consume …
E-Commerce Records Smashed
IBM and Comscore have started releasing data on Black Friday and Cyber Monday E-Commerce trends in the US consumer market. Both companies aggregate and anonymize visitor and e-commerce statistics from 1000s of the top consumer e-commerce websites to create their reports. To add some personal perspective, Enventys Partners also compiled and anonymized business to consumer e-commerce data from companies that work with us.
The big headline yesterday was IBM’s claim that Cyber Monday 2012 was “the biggest spending day ever with online sales growing 30.3%”. This follows the trend set for Cyber Monday 2011 where IBM stated “Online sales were up 33.0 percent over 2010.”
Comscore puts real dollars in their analysis stating that Black Friday 2012 “saw $1.042 billion in online sales, making it the heaviest online spending day to date in 2012.” Their Cyber Monday report states ” reached $1.465 billion in online spending, up 17 percent versus year ago”.
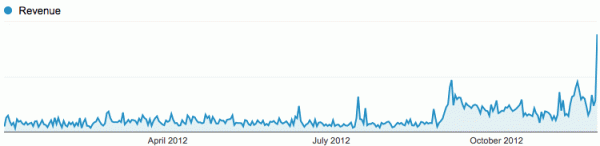
Our data shows similar results (see the graph at the top of this post). Cyber Monday was the single largest sales day for our business-to-consumer e-commerce clients by 87.5%. Sales revenue for our Cyber Monday sample was up 34.86% which is also inline with IBM’s projections.
Positive Online Shopping Trends
In terms of market segments, the big gainers were home goods, apparel, and department stores. Product categories that saw growth were digital content & subscriptions, toys, consumer packaged goods, video game consoles and accessories, and electronics.
The mobile trend continues to gain steam. The percentage for e-commerce transacted through mobile devices almost doubled. In 2011, mobile users represented 6.58% of sales, this year, it was 12.91%. All mobile device traffic increased but iOS devices clearly led the way in terms of share of sales generated and year to year growth. iOS dominance was particularly evident in the tablet field: 90.5% of sales conducted through tablet devices were conducted through an iPad.
The prevalence of iOS should be no surprise, Clicky’s market share for mobile report has consistently shown that iOS devices are utilized almost 3 times as much as Android devices.
Negative Implications for E-Commerce
It wasn’t all roses. Some digital channels experienced a tryptophan-fueled let down. According to the IBM report, the weekend was not good for social media-driven sales. Sales from sites like Facebook, Twitter, LinkedIn and Youtube fell significantly. Black Friday saw a 35.85% drop while Cyber Monday fell 26.79%. We’ll explore why we think that happened in our conclusions below but we also saw a year over year decline for socially-driven sales in our sample group. Facebook in particular was harsh with a near 50% drop.
Balancing this out for our clients were Pinterest and Reddit. While neither network provided any revenue in 2011’s sample group, both were in the top 5 revenue generating social networks for 2012.
Digital Strategy Takeaways
Brick and Mortar Businesses Need to Adapt. Best Buy aggressively went after online retailers this year with online price matching, free delivery, and an integrated mobile app (more on this in a moment). We’ll check back in to see if it worked.
Mobile Beats Social…Sorta. The drop in social network-driven sales was not expected but, in hindsight, it makes sense if you take into account the retail mobile app space. All of the top 5 retailers in Comscore’s report (previously linked) now have mobile shopping apps. These “walled gardens” e-commerce solutions are not allowing social networks inroads because they don’t want potential customers going elsewhere.
But how did those mobile shopping apps get out there in the first place? Most retailers promoted them…and the exclusive deals they provide, through their social media profiles.
Collectively, We Don’t Trust Facebook As Much. The recent deluge in sponsored posts and advertising on Facebook has made us wary and this was reflected in FB-driven sales numbers. Other networks with less commercial push (like Pinterest and Reddit) seem to be taking FB’s place for socially influencing purchase decisions.
Design for iOS. A mobile friendly website is a now a necessity but creating a mobile app for iOS should be a serious consideration for retailers. iOS powered devices provided 18.7% of all online revenue. Android, 5.5%. Our sample group also showed that iOS devices had the larger average ticket size by almost 17%.
Savvy Shoppers + Free Shipping is Hurting Ticket Size. Shoppers are using multiple services and websites to help them hunt for the best deal. The model of using loss leaders to lure online shoppers is dying off. Replacing it is a more common sense approach of low prices, free shipping, and loyalty rewards program.
Work With Us
Want to learn more about how we’d prepare your product for launch? Request a quote today.
Want To See This Advice In Action?
Check out our case studies and learn more about how we’ve achieved stellar results for our clients.